A RACI Chart is a powerful tool for enhancing communication, coordination, and collaboration across your business processes.
Are you familiar with the term RACI chart, sometimes called RACI Matrix?
A RACI Chart provides a concise visual representation of the roles and responsibilities for each team member in a project or process.
RACI stands for Responsible, Accountable, Consulted, and Informed.
RACI charts are an effective way to provide a clear understanding of task responsibilities. They clarify who is responsible for performing a given task, who is accountable for the overall success, who needs to be consulted for their expertise, and who needs to be kept informed of the task's progress.
Creating a RACI chart helps teams to delegate tasks effectively, establish accountability, and involve all necessary stakeholders.
How to build a RACI Chart
The chart is structured as a matrix, providing a clear visual representation of roles and responsibilities for a process.
To create a RACI Matrix, begin by identifying all the roles involved in the process and list them across the top of the matrix.
Then, identify all tasks for the process and list them in order of execution down the left-hand side.
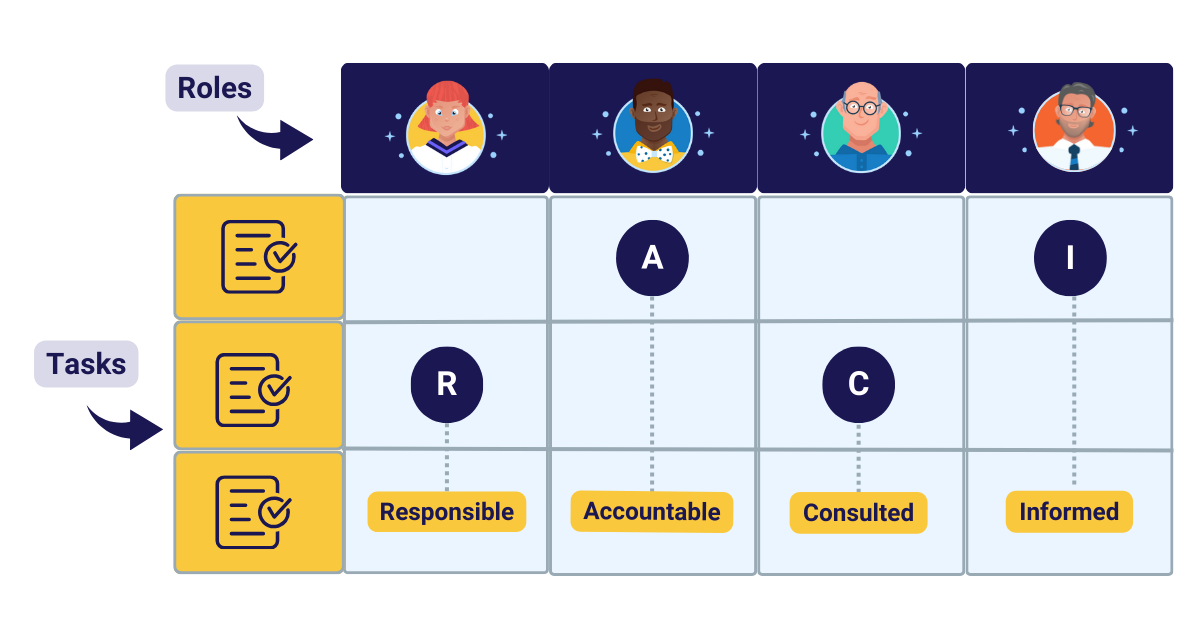
Identify the roles involved for each task and enter the appropriate RACI value in the intersecting cell.
- R: This identifies the person who is responsible for the successful completion of the task. The responsible person needs to understand the details of the task and its requirements so that they can execute it efficiently and effectively.
- A: This individual bears ultimate responsibility for the particular task. Usually, the accountable person is a supervisor or manager overseeing the person executing the task. There should only be one accountable person for each task to minimize the occurrence of blame and finger-pointing.
- C: This refers to a person with specialized expertise or knowledge consulted for their assistance in performing the task.
- I: Individuals who should be regularly updated on the task status to ensure transparency and effective communication.
Using RACI Charts for Project Management
The versatility of RACI Charts extends beyond process documentation and can be a valuable asset in project management.
Many project managers utilize RACI Charts as a project management tool for simple or complex projects.
Replace process roles with project roles and process tasks with project tasks. The result is a responsibility assignment matrix supporting your project management methodology.
As a project manager, the RACI chart becomes a powerful tool in your arsenal, allowing you to efficiently delegate tasks, establish clear accountability, and ensure the involvement of all necessary stakeholders and project team members.
By understanding the responsibilities associated with each role, a project manager can confidently assign the right individuals to appropriate project tasks, ensuring project success.
Business Process Modeling
Many organizations have made RACI an integral part of their business process design approach and process documentation.
Business process modeling involves mapping out the steps involved in a process and determining who is responsible for each step.
A RACI chart complements this by identifying who is accountable, consulted, and informed for each step, allowing team members to effectively delegate tasks and ensure that all stakeholders are involved.
RACI can also help identify any gaps or overlaps in responsibilities, allowing for timely adjustments to be made and ensuring that all crucial aspects of the process are covered.
The Benefits of Using a RACI Chart
There are numerous ways that a RACI matrix and help improve how you manage your processes or projects. Here are the top three benefits:
RACI Clarifies Roles and Responsibilities
RACI clearly defines the roles and responsibilities of each team member involved in a complex project or process. This clarity helps to reduce confusion, misunderstandings, and potential conflicts within the team.
RACI Improves Communication and Collaboration
A RACI chart is a valuable tool that visually represents who is responsible, accountable, consulted, and informed for each task or decision. This chart lets team members quickly identify who they need to work with or consult to move a process or project forward. The transparency of the chart promotes better coordination and cooperation and encourages open dialogue about roles, expectations, and dependencies, fostering a more productive and cohesive team environment.
RACI Enhances Efficiency and Accountability
By assigning clear roles and responsibilities, tasks are less likely to fall through the cracks or be duplicated, reducing unnecessary delays and errors. The chart also helps identify gaps or overlaps in responsibilities, allowing for timely adjustments and ensuring that all crucial aspects of the project or process are covered. Moreover, the explicit accountability designation holds individuals or groups answerable for their assigned tasks, promoting a sense of ownership and driving higher performance.
Tools for creating RACI Charts
When it comes to creating RACI Charts, there are several options available to suit different preferences and needs.
Many individuals prefer using drawing tools such as Visio, PowerPoint or LucidChart, which offer a wide range of features and customization options.
These drawing tools provide a user-friendly interface that allows you to easily create and edit your RACI chart, making it visually appealing and easy to understand. Many drawing tools provide a RACI chart template.
Some prefer using Microsoft Excel for RACI charts, as it offers a versatile platform for organizing charts in a tabular format. With Excel, it's easy to add or remove rows and columns, adjust formatting, and apply formulas. This is especially useful for those who are familiar with Excel and enjoy working with spreadsheets.
You may also find support for RACI Charts in the project management tool or Business Process Management tool you are using. For example, Asana project management software supports the creation of RACI charts.
The Navvia Process Designer, a leading BPM tool, supports the automatic creation of RACI Charts from your process flow diagrams. Sign up for a live demo of Navvia.
The RACI chart is a valuable tool for businesses to improve productivity. It clarifies roles and responsibilities on a single page, enhancing communication for any project or process.