Few tools are as effective as process diagrams when it comes to conveying the ins and outs of business processes. These diagrams provide a clear and concise visual representation of the who, what, and how of your business process.
During my career, I've had the opportunity to work with process diagrams from various perspectives.
As an employee, I've used process diagrams to understand what needs to be done. As a business consultant, I've helped assess and improve my client's processes. As one of the co-founders of Navvia, I worked with our team to create the Navvia Process Designer, a powerful process mapping tool.
I have seen firsthand the benefits of having well-defined processes, and I strongly advocate using process diagrams to improve a company’s performance. The purpose of this post is to share some of that experience with you and explain how to create flowchart diagrams to visualize data, workflows, and activities.
What are Process Diagrams?
Definition of Process Diagrams
A process diagram is a visual representation of a business process, system, or workflow that illustrates the sequence of steps, activities, and decisions involved in achieving a specific goal or objective.
These diagrams serve as powerful tools for communicating complex processes, identifying inefficiencies, and improving overall productivity. By providing a clear and concise visual representation, process diagrams help teams understand the intricacies of a business process, making it easier to analyze and optimize.
Brief History of Process Diagrams
The concept of process diagrams dates back to the early 20th century, when industrial engineers and management theorists began using flowcharts to visualize and optimize manufacturing processes.
These early diagrams were instrumental in improving efficiency and productivity on the factory floor.
Over time, the use of process diagrams has expanded beyond manufacturing to virtually every industry, including software development, information technology, healthcare, higher education, retail, and finance.
Today, process diagrams are essential tools for improving communication, collaboration, and process efficiency across a wide range of business environments.
What are the benefits of a workflow diagram?
Let's start by discussing some of the benefits of workflow diagrams.
- Improved Communication and Collaboration: Process diagrams are an effective tool that visually represents complex workflows clearly and concisely. This simplifies communication between team members, leading to improved collaboration and a more streamlined working environment.
- Increased Efficiency and Productivity: By mapping out each process step, process diagrams help identify bottlenecks, redundancies, and areas for improvement. This allows organizations to optimize their workflows and streamline operations, increasing efficiency and productivity.
- Simplified Onboarding and Training: Process diagrams serve as excellent training materials for new employees, helping them quickly grasp their roles' key steps and responsibilities. This reduces the learning curve and ensures that new team members can hit the ground running.
- Continuous Improvement and Innovation: Using process diagrams encourages a culture of continuous improvement, making it easy to identify areas for optimization and innovation. By regularly reviewing and updating process diagrams, organizations can foster a mindset of constant growth and development, driving long-term success.
- Process Automation and Digital Transformation: Process diagrams help visualize and optimize workflows and are essential for automating processes. By mapping out each step of a process through a diagram, organizations can quickly identify which steps are repetitive, time-consuming, or error-prone, making them ideal candidates for automation. These diagrams are also a fundamental tool for mitigating the risk of digital transformation failures. Whether it's optimization or transformation, the diagram serves as a blueprint for automating your processes. Combine this with User Story Mapping, and organizations can automate faster and with less rework.
Process diagrams can also support organizational change management by helping get people on the same page, risk management by identifying process controls, and resource allocation by identifying areas where resources may be underutilized or overextended.
Improved Communication and Collaboration
Process diagrams facilitate improved communication and collaboration among team members, stakeholders, and customers by providing a clear and concise visual representation of complex processes.
By using standardized symbols and notation, process diagrams enable individuals with different backgrounds and expertise to understand and contribute to process improvement initiatives.
This common visual language helps bridge gaps in understanding, ensuring that everyone is on the same page and working towards the same goals.
Enhanced Process Efficiency and Productivity
Process diagrams help organizations streamline their workflows, reduce waste, and increase productivity by identifying bottlenecks, inefficiencies, and areas for improvement. By visualizing the process flow, teams can optimize resource allocation, reduce cycle times, and improve overall process performance. Additionally, process diagrams enable organizations to standardize processes, reduce errors, and improve quality, leading to enhanced customer satisfaction and loyalty. By providing a clear roadmap for process improvement, these diagrams are invaluable tools for driving continuous improvement and achieving operational excellence.
How do workflow diagrams help in Business Process Management (BPM)?
Process diagrams are often used as standalone artifacts to document a business process.
Ideally, they should be used as part of a broader Business Process Management program. So what is Business Process Management?
Business Process Management (BPM) is a systematic approach to optimizing, analyzing, and managing an organization's various processes, workflows, and activities in order to improve efficiency, effectiveness, and adaptability. The goal of BPM is to enhance overall business performance, reduce costs, and increase customer satisfaction by streamlining operations, identifying areas for improvement, and implementing changes in a controlled and structured manner.
BPM involves the following key components:
- Process Identification
- Process Design/Modeling
- Business Process Automation
- Process Execution
- Process Monitoring/Controlling
- Process Optimization & Re-engineering
What Are Workflow Diagrams Used For?
During my career I used process diagrams to support virtually all phases of a BPM program, from identification through to modeling and optimization. Here are some example of when to use a workflow diagram.
During process identification I use workflows to map out processes, sometimes referred to as the "as-is" process. The as-is process diagram serves as a starting point for process analysis and improvement efforts, providing a baseline understanding of how things are currently functioning.
During the process design phase I used process diagrams to capture the future or "to be" process. A "to-be" process refers to the desired future state of a business process or workflow after implementing improvements, optimizations, and changes. The "to be" process represents the organization's vision for how the process should function to achieve better efficiency, effectiveness, and overall performance.
During process automation I found process workflow diagrams to be essential. How do i automate a workflow? I typically start with the "to-be" process flowcharts. This helps me identify the activities, tasks and decision points that need to be automated. I also create a process state diagram to show how the process will flow through a system. I then capture user stories to define the business requirements and functional requirements such a data fields and email notifications. Together, this creates a breath blueprint for automation.
During process execution I use process diagrams as a reference point to endure the process is being executed as defined. This is a great tool for process owners. management and stakeholders.
During process monitoring I use the process workflow diagram to identify measurement points and controls for a process. This is essential for business process governance.
During process optimization & Re-engineering I use the process diagrams to identify bottlenecks and areas of improvement. Along with workflow diagrams, I also use SIPOC diagrams to summarize process suppliers, inputs, process steps, outputs, and customers.
How to create a workflow diagram.
Creating a workflow diagram is a crucial step in effectively documenting and improving business processes. Here are the key steps you need to follow to create a workflow diagram:
- Identify the Process: Begin by clearly understanding the process you want to document or improve. Define the boundaries and scope of the process, and identify the key inputs, outputs, and stakeholders involved.
- Gather Information: Collect all the necessary information about the process. This may involve conducting interviews, reviewing existing documentation, or observing the process in action. Ensure that you have a comprehensive understanding of each step and decision point within the process.
- Determine the Level of Detail: Decide on the level of detail you want to include in your workflow diagram. This will depend on the purpose of the diagram and the audience you are targeting. You can choose to create a high-level overview (such as a Level 0 or SIPOC), or a more detailed diagram capturing all activities, tasks and decision points.
- Select a Diagramming Tool: Choose a suitable diagramming tool to create your workflow diagram. There are various options available, ranging from simple software like Microsoft Visio or enterprise tools like the Navvia PRocess Designer. Select a tool that aligns with your preferences and requirements. Read: A Guide to Selecting Business Process Mapping Tools
- Define Symbols and Notation: Familiarize yourself with the symbols and notation commonly used in workflow diagrams. This will help ensure consistency and clarity in your diagram. Use standard symbols such as Business Process Modeling Notation (BPMN) or standardized flowchart symbols.
- Map Out the Process: Start by identifying the process's location within the company (Level 1), then specify its category (Level 2), and finally, define the process itself (Level 3). Break the process into key activities (Level 4) and represent each activity with a process diagram outlining the specific tasks (Level 5). Connect these tasks with arrows to illustrate the sequence and flow, beginning with the initial trigger or event and continuing until the desired outcome is achieved. Use these "Process Levels" to enhance clarity and provide detailed insights into each stage.
- Review and Validate: Review your workflow diagram to ensure accuracy and completeness. Validate it with stakeholders and subject matter experts to confirm that it accurately represents the process. Incorporate any feedback or suggestions to improve the clarity and effectiveness of the diagram.
- Enhance your workflow diagram: Augment your process diagram by adding additional information and annotations as part of an overall process document. This can include descriptions of each task, decision criteria, data inputs & outputs, controls & metrics and any dependencies or constraints that exist within the process.
- Document and Share: Once your workflow diagram is finalized, document it in a format that is easily accessible and shareable. This could be in the form of a PDF, an image file, or within a collaborative software tool. Make sure it is easily understandable for anyone who needs to refer to it.
Process Diagrams vs. Process Documentation
When it comes to process documentation, a process diagram is only a piece of the puzzle. While it is a helpful visual representation that provides a basic understanding of the process, it may not contain all the information necessary to fully comprehend the process.
What are the goals and obiectves of the process? What are the roles and responsibilities of various stakeholders? How is the process governed? What about the tools and workinstructions supporting the process?
When documenting your processes its important to go beyond the process diagram and delve deeper into all as[pects of the process.
To learn more about process documentation check out our Complete Guide To Process Documentation.
Workflow Diagram Examples
Let's explore different process workflow diagram types. It's important to note that there isn't a single way to document your processes. It's best to assess your needs and decide which approach works best for you and your organization. Here are some examples of ways to create process workflow diagrams.
Flowchart Diagrams
Computer flowchart diagrams are graphical representations that illustrate the sequence of operations to be performed to get the solution to a problem. These diagrams are widely used in software engineering and programming to visualize the flow of control or data in a system.
In the early days of computer programming, before the advent of sophisticated software tools, programmers relied on a trusty tool called the flowchart stencil. This stencil was a physical template that allowed programmers to map out the flow of their computer programs before even starting to write the actual code.
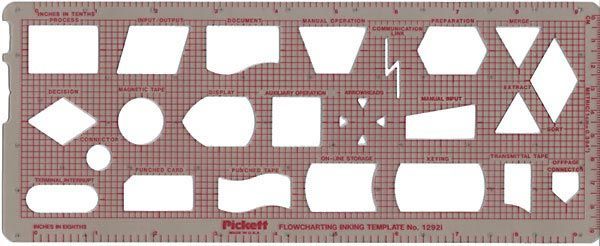
Flowchart stencils may be outdated, but the concept of visualizing program flow and logic remains crucial in computer programming.
Programmers and business analyst still utilize the basic flowcharting symbols to map our their processes in tools like Microsoft Visio or the Navvia Process Designer.
Swim lane Diagrams
A swim lane diagram, also known as a cross-functional flowchart or a process map, is a visual representation of a workflow that organizes activities into different lanes or columns based on the departments, functions, or individuals involved in the process. The swim lane diagram provides a clear and structured view of how tasks move through different stages and who is responsible for each step.
The following example shows the first activity of an Incident Management process.

Click to download the full Incident Management Process Workflow Diagram
LOVEM Diagrams
A Line of Visibility Enterprise Modeling (LOVEM) diagram is a type of business process modeling notation that was developed by IBM. It's designed to represent business processes in a way that clearly differentiates between activities visible to the customer and those that are not. While similar to swim lane diagrams, the focus is on the visibility of customer touch points.

This visibility distinction is important because it helps organizations understand the customer's perspective and experience. By identifying all the touch points and interactions that a customer has with an organization, LOVEM diagrams can help improve customer service, streamline operations, and identify areas for improvement.
Business process modeling notation (BPMN) diagrams
A BPMN diagram, which stands for Business Process Modeling Notation, is a graphical representation used to illustrate and document business processes. It provides a standardized way to visualize and communicate complex processes, making it easier for stakeholders to understand and analyze them.
BPMN diagrams use a specialized set of symbols and notation representing different process elements, such as tasks, events, gateways, and flows. Download your free BPMN poster courtesy of Berliner BPM-Offensive.
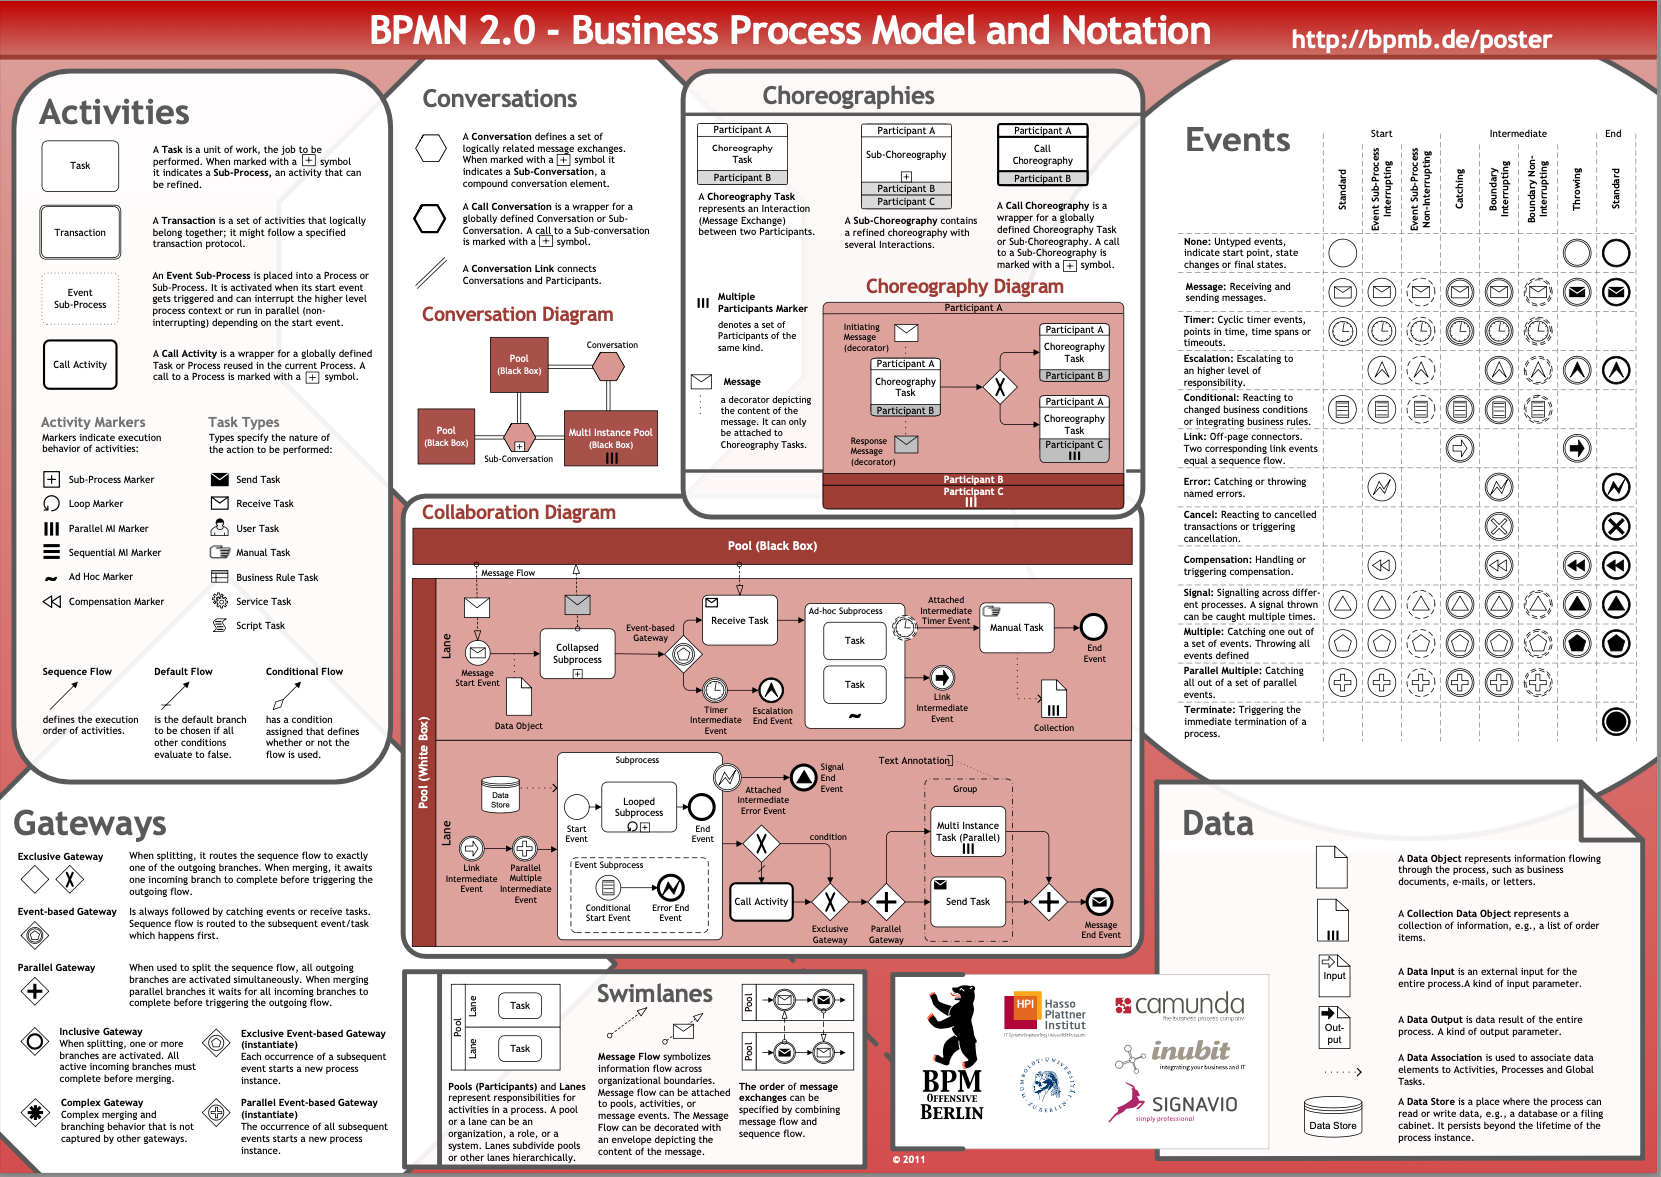
BPMN is a useful method for documenting processes, but it requires advanced expertise to apply. The notation is highly detailed, which makes it perfect for complex processes. However, it may be too difficult for the average user to understand.
SIPOC Diagrams
A SIPOC diagram is an essential tool for designing or improving business processes. It is a concise way to identify the suppliers, inputs, high-level process steps, outputs, and customers (SIPOC) of the process.
SIPOC diagrams help communicate a process at a high level are an instrumental tool for process improvement.
The following example of a SIPOC diagram show the process of baking and selling pizza.
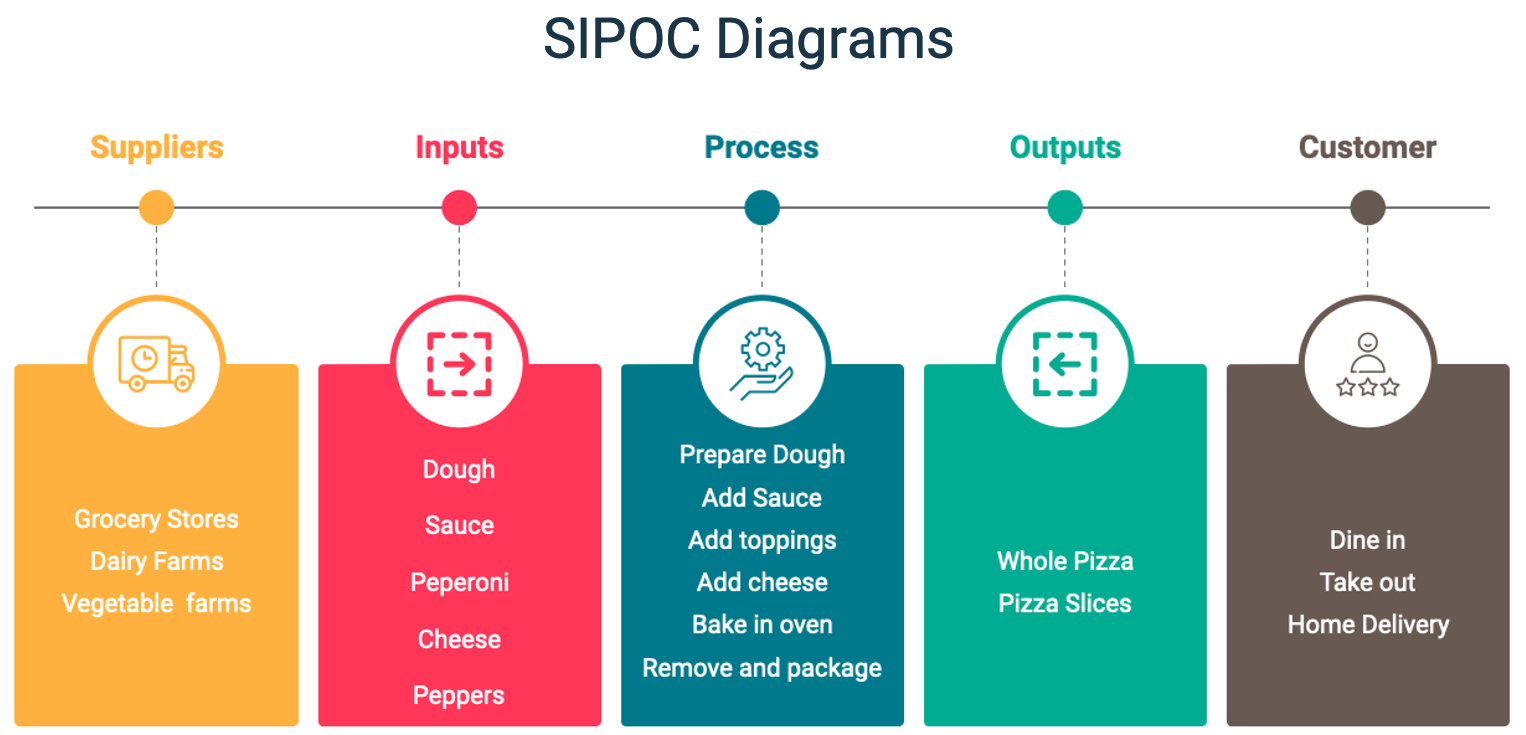
To learn more about SPIOC read: What is a SIPOC diagram - An Introduction.
Value Chain Diagrams
A value chain diagram is a visual representation of the activities a company performs to deliver a product or service to the market. It illustrates the process from the initial raw materials to the final customer interaction, highlighting where value is added at each step. This diagram helps businesses identify their strengths, improve efficiencies, and enhance customer value.
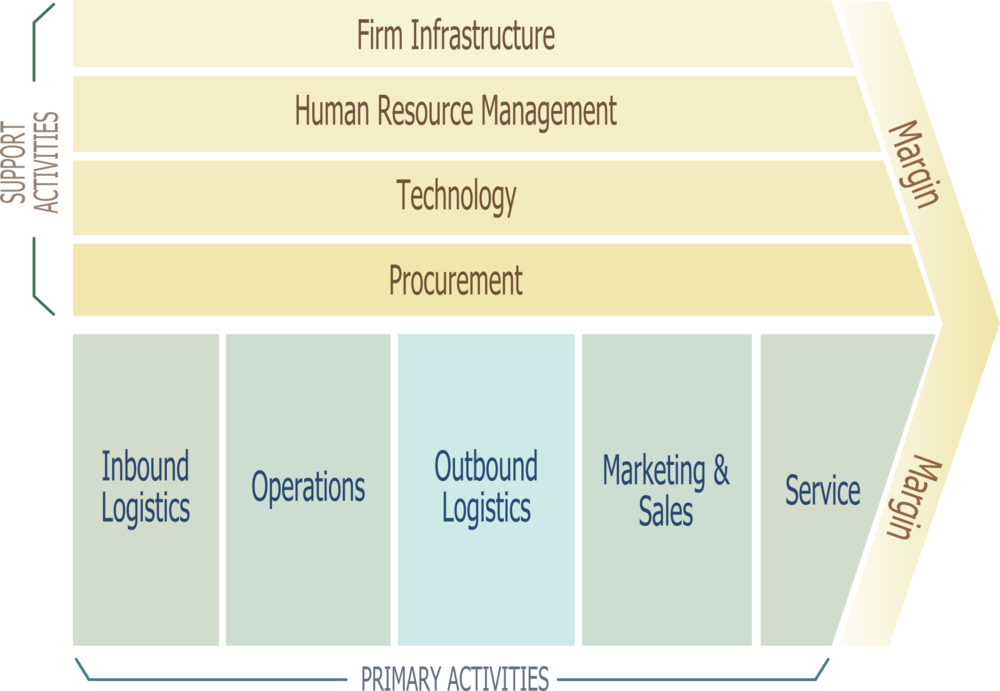
Source: Wikipedia
A value chain diagram is often the first step in defining your processes. It provides the "big picture" from which you can identify the specific activities and steps involved in delivering a product or service to the market. By mapping out the value chain, you can gain a comprehensive understanding of how different elements of your business interact and contribute to the overall value creation process.
By starting with a value chain diagram, you lay the foundation for optimizing your processes and driving business success.
Process diagrams provide a clear and concise visual representation of business processes. Benefits of workflow diagrams include improved communication and collaboration, increased efficiency and productivity, simplified onboarding and training, continuous improvement and innovation, and process automation and digital transformation.