A SIPOC diagram is an essential tool for designing or improving business processes. It is a concise way to identify Suppliers, Customers, Inputs, Outputs, and Process steps, all on a single page!
Process Modeling & the SIPOC Diagram
Processes are the lifeblood of an organization. They lay out the flow of work so that people understand what they need to do and how to do it. Process maps also act as the blueprint for automation.
A process is a set of activities that transforms inputs into value-added outputs.
Business Process Modeling, typically performed by a process analyst, is an exercise designed to document all aspects of the process. The analyst captures process steps, roles & responsibilities as well as metrics, controls, and supporting tools.
There are many artifacts that result from a process mapping exercise.
These can include process guides, RACI charts, process workflow diagrams, procedural information, and technical specifications (requirements) for Business Process Automation (BPA).
One of the most powerful, and often overlooked, documents from a process mapping exercise is the SIPOC diagram.
This diagram puts the key aspects of the process on a single page. It's a great starting point for designing the process as well as a powerful tool for process improvement by providing a high-level overview of the overall process, mapping the major steps that transform inputs into outputs.
Check out our Introduction to Process Mapping to learn more!
What is the meaning of SIPOC?
A SIPOC diagram is a high-level visual tool used in business process management and process improvement to outline the key components of a process. SIPOC stands for Suppliers, Inputs, Process, Outputs, and Customers.
The diagram helps teams understand the scope of a process by identifying who supplies inputs to the process, what those inputs are, the steps of the process itself, the outputs produced, and who receives these outputs.
It is often used in Six Sigma and Lean methodologies to ensure clarity and alignment before delving into more detailed process analysis.
Components of a SIPOC Diagram
A SIPOC diagram consists of five key components: Suppliers, Inputs, Process, Outputs, and Customers. Understanding each of these components is essential to effectively leveraging the power of this tool in process improvement efforts.
Suppliers:
These are the individuals, departments, systems, or external entities that provide the necessary inputs for the process under consideration.
Suppliers can be internal or external to the organization and play a crucial role in ensuring the process functions properly. Here are some examples of suppliers:
- A role is a function played by a person. For example, a client fills out an order form that kicks off the order fulfillment process.
- A system is typically a software product used by the organization. For example, an automated monitoring system can provide an alert to a Service Desk agent kicking off an incident management process.
- Inter-process: In the same way a system can provide information to a process, so can another process. For example, the expense reporting process can be a supplier to the reimbursement process.
Inputs:
Inputs are the materials, resources, or information required for the process to function properly. These inputs are provided by the suppliers and are essential for the process to produce the desired outputs.
An input is a trigger for the process. Inputs are something transformed, consumed, used, or processed. They can sometimes be the output of another process.
The process of manufacturing a product, such as a car or a cell phone, requires many inputs. These can include the various components that need to be assembled or the labor required to assemble them. These inputs come from Suppliers.
Process:
The process is the series of steps or activities that transform inputs into outputs. This is the core of the SIPOC diagram, detailing the high-level process map that outlines how inputs are converted into value-added outputs.
In the example of manufacturing a car, the inputs are put through a manufacturing process resulting in a fully assembled car.
The manufacturing process can include welding the frame, inserting the drive train, rust-proofing, painting, and a final quality check.
Accurately depicting process flow is crucial to identify bottlenecks and enhance overall productivity.
Outputs:
Outputs are the end products, services, or deliverables generated by the process under consideration and are often used as inputs for subsequent processes.
- Examples of outputs: The insurance claim process has the output of a processed claim. Manufacturing processes result in assembled goods. The fulfillment process results in having something shipped to a customer.
Customers:
Customers are the individuals or entities that receive and benefit from the outputs of the process. They can be internal or external to the organization and are the ultimate recipients of the process outputs.
Similar to a supplier, any role, system, or inter-process connection that receives outputs from the process can be a customer.
- A role is a function played by a person. A client who placed an order ultimately becomes a customer of the process when their product is received.
- One process can feed another. For example, the shipping process is a customer of the order-picking process.
- Different software systems may be involved in the end-2-end ordering process. For example, once the order is placed information may be passed to a payment system. In this example, the payment system is the customer
Steps to Create a SIPOC Diagram
Creating a SIPOC diagram is a straightforward process that involves the following steps:- Identify the process to be mapped: Select the business process that you want to improve or understand. This could be any process within your organization that requires analysis or enhancement.
- Define the process boundaries: Determine the starting and ending points of the process. This helps in setting clear limits on what the SIPOC diagram will cover.
- Identify the suppliers: Determine who provides the inputs to the process. These could be internal departments, external vendors, systems, or other processes within the organization.
- Identify the inputs: Determine what materials, resources, or information are required for the process to function properly. These inputs are essential for the process to produce the desired outputs.
- Map the process: Create a high-level process map that outlines the key steps involved in transforming inputs into outputs. This should be a concise representation of the process, focusing on the main activities.
- Identify the outputs: Determine what end products, services, or deliverables are generated by the process. These outputs are the results of the process and are often used as inputs for subsequent processes.
- Identify the customers: Determine who receives and benefits from the outputs of the process. These could be internal departments, external clients, systems, or other processes within the organization.
SIPOC Example
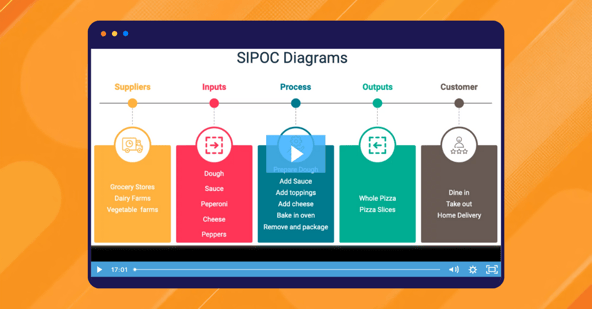
The following is a simple example of the SIPOC diagram. We will be using something we can all relate to, the creation of pizza.
You can watch the following video or continue reading the blog.
The SIPOC chart shows a number of Suppliers including grocery stores, dairy farms, and vegetable farms. Other suppliers to the process could include servers or cooks.
These suppliers provide the Inputs (raw ingredients) for the pizza. Other inputs into the process could have included the labor and operating costs of running the restaurant.
The main activities of creating the pizza are listed in the Process column. The process is not to be confused with detailed procedural steps. We recommend no more than 8 process steps (to keep things simple).
The Output of the process is pizza, either whole or by the slice.
And the Customers are defined by Role, dine-in, take-out, and delivery.

Top 5 benefits of a SIPOC diagram.
1. Helps to Define a Process
A SIPOC diagram provides an overall look at a process. This diagram focuses on suppliers, inputs, key activities, outputs, and customers. Create a SIPOC diagram as a starting point when designing a new process or when trying to improve an existing one.
Learn how Business Process Management can help your organization design consistent ways of working to increase performance
Read here
2. Helps to Identify Problems
Another benefit is that it can help to identify problems within a process. Start by mapping the process and identifying suppliers, inputs, outputs, and customers. Use this diagram in problem-solving sessions with stakeholders to help to find any potential issues. For example, delays in the process could be caused by an issue with one of the suppliers.
3. Helps to Improve Communication
A SIPOC diagram can also help to improve communication within an organization. It gets people on the same page by clearly mapping out the process and identifying the various stakeholders. This information helps to ensure that all team members are working towards the same goal. This can be especially helpful in large organizations where there may be many different departments and individuals involved in a process.
4. Helps to Reduce Waste and Improve Process Outputs
Another benefit is that it can help to reduce waste within a process. The SIPOC provides an excellent high-level view of the process. This view can make it easier to spot areas where there may be unnecessary steps or duplicate information. The SIPOC is often used in lean six sigma projects to streamline the process and make it more efficient.
5. Can Be Used for Multiple Purposes
Finally, a SIPOC diagram is that it can be used for multiple purposes.
During the define phase of the Six Sigma DMAIC methodology, teams utilize the SIPOC diagram to delineate the project scope, identify key stakeholders, and align goals with customer requirements.
In addition to being used for process improvement, it can also be used in a number of areas. These include training new employees, project management, understanding customer requirements, or documenting an existing process.
Getting Started
If you are new to creating a SIPOC diagram you can start with a SIPOC template. Many templates are available on the internet or in many of the process modeling tools, such as the Navvia Process Designer. Check out our guide to selecting business process mapping tools.
You can start by bringing together team members with a good understanding of the process you wish to document. These identify the suppliers, inputs, process steps, outputs, and customers of the process.
Tools and Resources
- Microsoft Visio: A popular diagramming software that offers a range of templates and tools for creating SIPOC diagrams. It is widely used in business process mapping and can help create detailed and professional diagrams.
- SmartDraw: A diagramming software that offers a range of templates and tools for creating SIPOC diagrams. It is known for its ease of use and versatility in creating various types of diagrams.
- Navvia Process Designer: A comprehensive process design, documentation and assessment tool that enables organizations to model, document, share, and analyze business processes. Navvia auto-generates SIPOC diagrams from process flow diagrams created within the product.
- SIPOC diagram templates: Pre-designed templates that can be used to create a SIPOC diagram. These templates can be found online and in many process modeling tools, providing a quick and easy way to get started.
Tips and Best Practices
Here are some tips and best practices to keep in mind when creating a SIPOC diagram:
- Keep it simple: Avoid including too much detail in the SIPOC diagram. Focus on the high-level process map and key components to ensure clarity and ease of understanding.
- Use clear and concise language: Use simple and clear language to describe the process and its components. This helps ensure that everyone involved can easily understand the diagram.
- Involve stakeholders: Involve stakeholders in the creation of the SIPOC diagram to ensure that everyone is aligned and understands the process. This collaborative approach can lead to more accurate and effective diagrams.
- Review and revise: Review and revise the SIPOC diagram regularly to ensure that it remains accurate and up-to-date. Processes can change over time, and the SIPOC diagram should reflect these changes.
- Use it as a starting point: Use the SIPOC diagram as a starting point for process improvement efforts. It can help identify areas for improvement and provide a framework for implementing changes, making it a valuable tool for continuous improvement.
A Potent Tool for Process Improvement Efforts.
SIPOC diagrams gained prominence as part of Total Quality Management (TQM) programs back in the '80s. Today, SIPOC diagrams are an essential part of Lean Six Sigma initiatives, lean manufacturing, and general process design and improvement projects. SIPOC is also used with Agile, Lean (Kaizen event), or other Continuous Process Improvement methods.
One example is Value Stream Mapping. The SIPOC diagram is the starting point for decomposing a process and problem-solving issues with the process.
Continuous process improvement is also a key use case for this diagram. One such example is the DMAIC cycle. DMAIC is a continuous improvement approach and stands for Define, Measure, Analyze, Improve, and Control. The SIPOC provides an excellent overview of the process to help drive improvement.
Another example includes project management. The SIPOC diagram can be used to identify the key elements of your project. This helps in keeping an eye on the big picture and improving project execution.
The SIPOC is used to capture the process on a single page before any process improvement work begins.
To learn more about how SIPOC can improve process management check out this article: 5 Benefits of a SIPOC diagram.
The SIPOC diagram is one of the most powerful, yet overlooked, process tools at your disposal. It captures the process on a single page so you can better communicate the value, identify issues or initiate process improvement.